PostgreSQL enables the user to create tables in the relational database to store data in them using SQL queries. It allows the user to query these tables and fetch data according to the user’s requirements and gain useful insights through that information. The user can create pivot tables in PostgreSQL to convert data in the rows with the columns data.
This guide explains the process of creating a Pivot table in PostgreSQL.
How to Create A Pivot Table in PostgreSQL
Pivot tables are created to transform the data from the rows to the columns and it can be used to get the results according to a particular column in the table. The user can create a pivot table in PostgreSQL using either the crosstab function which is provided by the tablefunc or using the CASE statement.
Using Crosstab Function
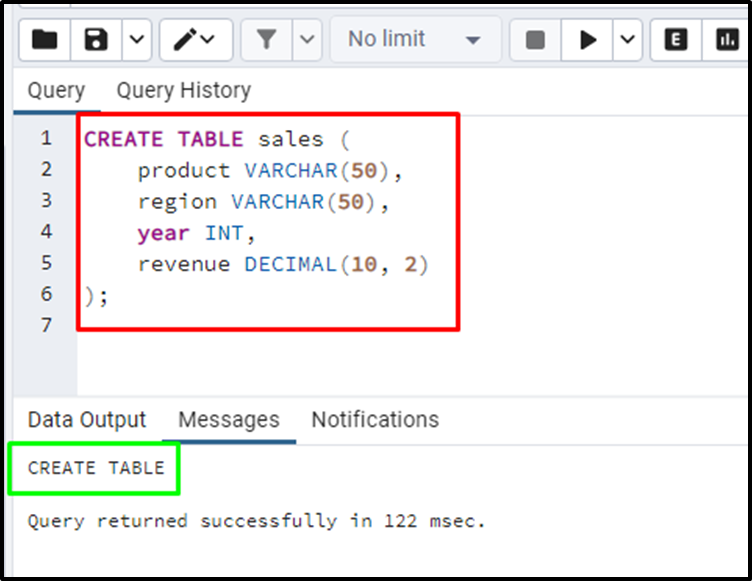
Use the following query to create a table in the PostgreSQL database:
CREATE TABLE sales (
 product VARCHAR(50),
 region VARCHAR(50),
 year INT,
 revenue DECIMAL(10, 2)
 );
The above query creates a table named sales with product, region, year, and revenue columns:
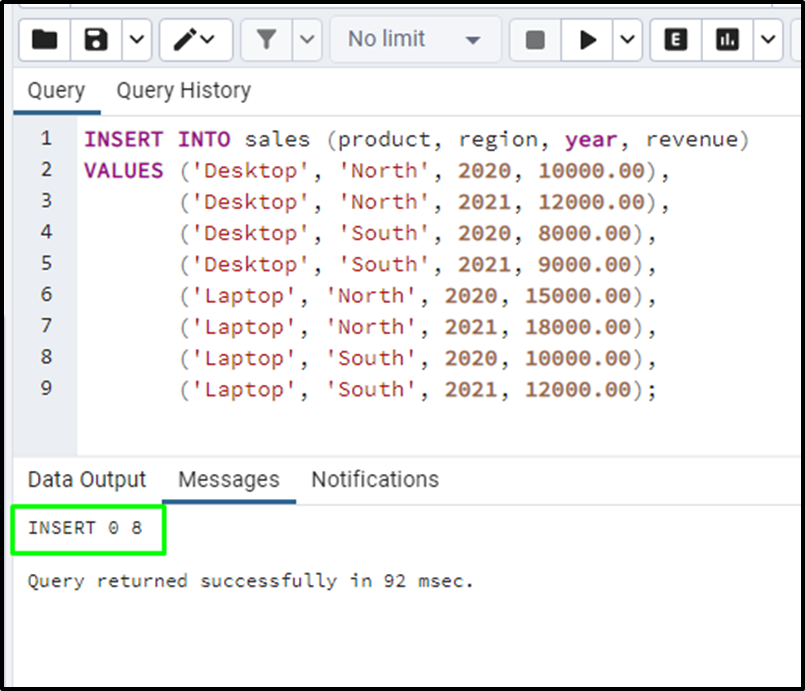
Insert the data in the sales table using this query:
INSERT INTO sales (product, region, year, revenue)
 VALUES ('Desktop', 'North', 2020, 10000.00),
  ('Desktop', 'North', 2021, 12000.00),
  ('Desktop', 'South', 2020, 8000.00),
  ('Desktop', 'South', 2021, 9000.00),
  ('Laptop', 'North', 2020, 15000.00),
  ('Laptop', 'North', 2021, 18000.00),
  ('Laptop', 'South', 2020, 10000.00),
  ('Laptop', 'South', 2021, 12000.00);
The above query inserts data in the product, region, year, and revenue columns of the sales table:
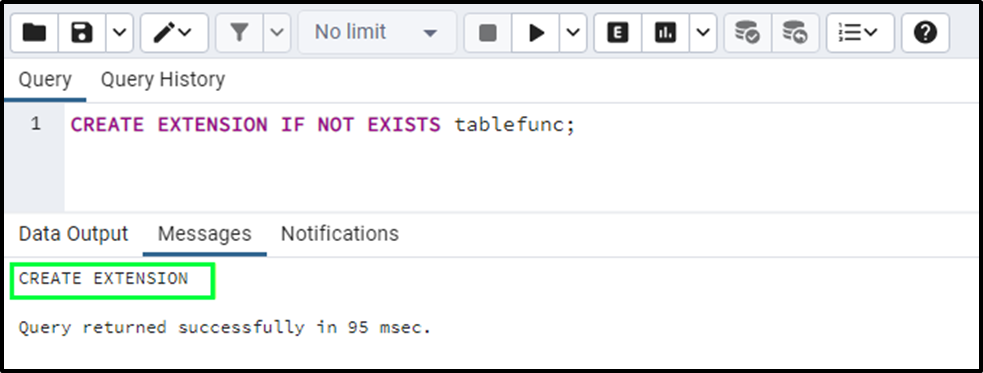
To create a pivot table in PostgreSQL using the Crosstab function, it is required to create an extension named tablefunc. For this purpose, execute the following piece of code:
CREATE EXTENSION IF NOT EXISTS tablefunc;
Running the above command will create the extension as displayed in the screenshot below:
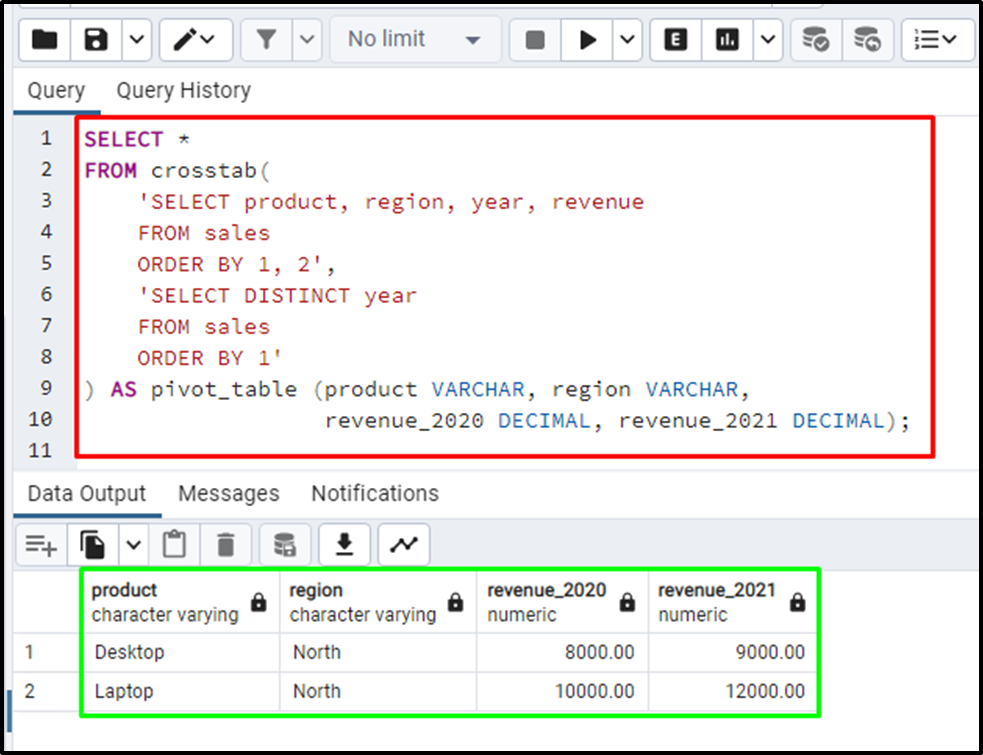
Once the extension is created, type the following code to create a pivot table using the crosstab function:
SELECT *
 FROM crosstab(
 'SELECT product, region, year, revenue
 FROM sales
 ORDER BY 1, 2',
 'SELECT DISTINCT year
 FROM sales
 ORDER BY 1'
 )AS pivot_table (product VARCHAR, region VARCHAR, revenue_2020 DECIMAL, revenue_2021 DECIMAL);
The above code uses the crosstab function to create a pivot table of sales table with product, region, year, and revenue columns. The following screenshot displays the revenue generated in the years 2020 and 2021 from the sales table:
Using CASE Statement
The user can create a pivot table using the CASE statement:
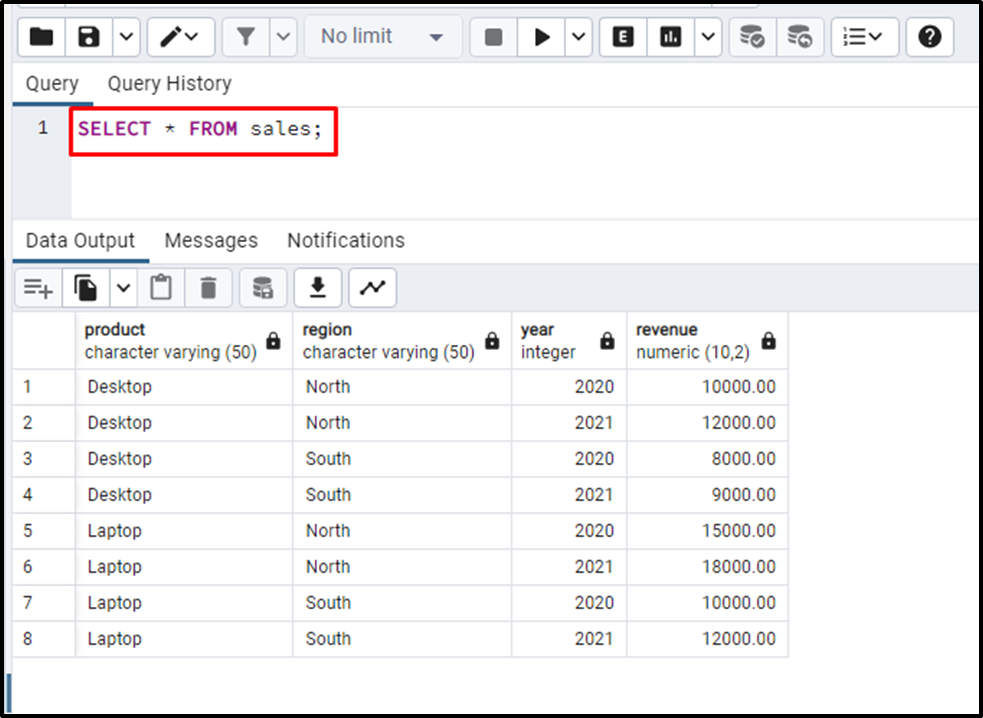
SELECT * FROM sales;
The above query fetches all the data from the sales table and displays it on the screen:
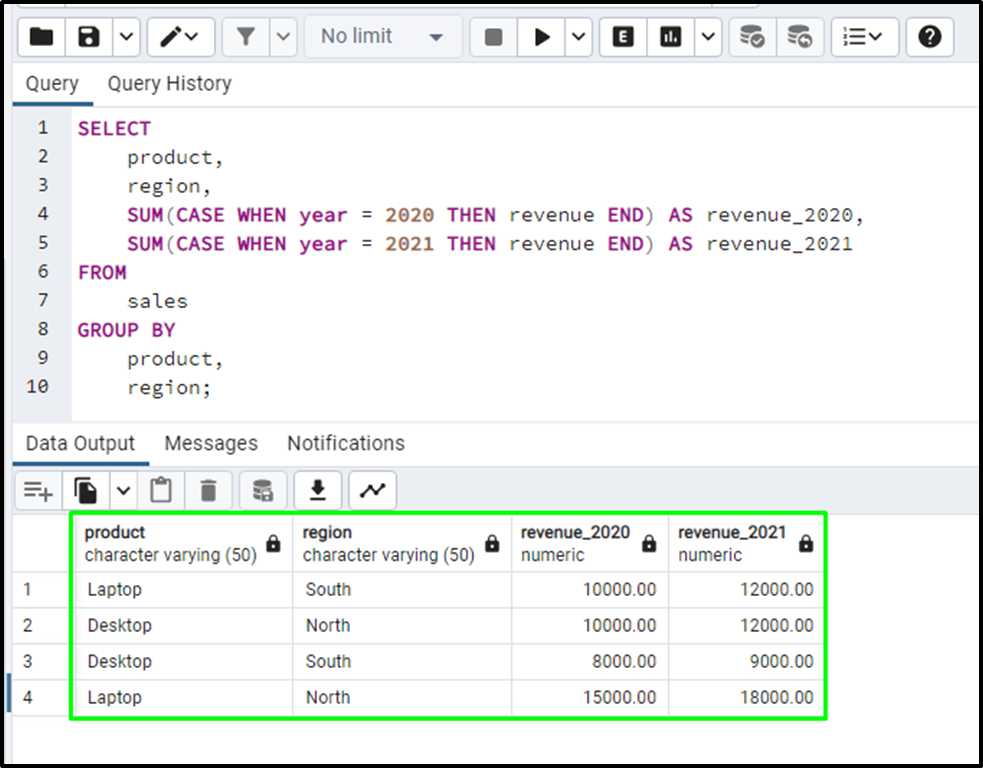
Use the following CASE statement with the SUM function to create a pivot table:
SELECT
  product,
  region,
  SUM(CASE WHEN year = 2020 THEN revenue END) AS revenue_2020,
  SUM(CASE WHEN year = 2021 THEN revenue END) AS revenue_2021
 FROM
  sales
 GROUP BY
  product,
  region;
The above code selects the product and region column from the sales table and uses the SUM function to add the revenue according to each year. The following screenshot displays the data from the sales table which is grouped by product and region to get the revenue for the years 2020 and 2021:
That’s all about creating a pivot table using the crosstab function and CASE statement.
Conclusion
To create a pivot table in PostgreSQL, create a table and insert data in a Postgres table using SQL queries. Once the table is created in PostgreSQL, the user can either create a Pivot table using the crosstab function or a CASE statement. This guide has demonstrated the process of creating a pivot table in PostgreSQL.